

Direct vs. Indirect Methods for Characterization and Analysis of Subvisible Particles – A Comparative Study
Characterization and analysis of subvisible particles of biological origin can be challenging or give insufficient information. In this study Adeno associated virus (AAV) particles contaminated by host cell proteasomes are analysed with direct versus indirect methods performed in a standard laboratory setting to reveal the difference in performance and quality of the information obtained. The focus is on the ability to detect the AAV particles of interest and distinguish them from the contaminating proteasomes. The compact, tabletop MiniTEM system enables automatic sample screening and imaging together with direct measurements of particle size and particle classification. This method is compared with the indirect methods Dynamic Light
Scattering (DLS) and Nanoparticle Tracking Analysis (NTA) measurements using Zetasizer Nano and NanoSight NS300 respectively. Both the DLS and NTA methods measure the Brownian motion of the particles or molecules in suspension and use the Stokes-Einstein equation to give the particle size distribution.
Introduction
Biopharmaceutical manufacturers are under pressure to characterize and measure subvisible particles in injectable drug products to verify particle quality and absence/presence of subvisible aggregates and contaminants.
Accurate analytical technologies are especially challenged to provide sufficient information for particles below 50 nm The detection level of indirect techniques is either limiting or does not distinguish the difference between particles of interest from contaminants of similar size or from bigger aggregates.
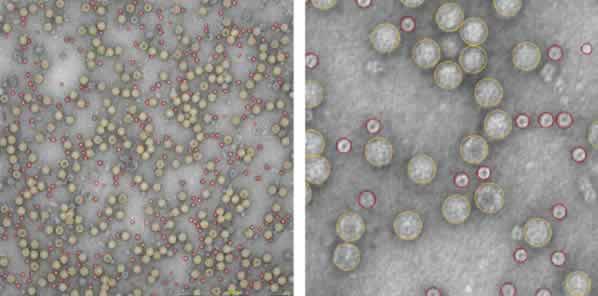
Traditional electron microscopy result in high resolution images that provide morphological information and allow particle identification. The disadvantage is however the need of an expert operator and complex laboratory settings. MiniTEM shifts the balance by providing ease, speed and cost efficiency at the same time as visual proof of EM quality and accurate measurements. It is a compact tabletop system that can be placed in any standard laboratory or office setting and it provides automatic sample screening and imaging together with instant measurements of particle size, particle classification and aggregate detection in the range of 10-15000 nm. The MiniTEM measurements in this study were performed by the Vironova research and development team at Vironova AB laboratories in Stockholm, Sweden.
Nanoparticle Tracking Analysis (NTA) is a technique for visualizing and analyzing particles in liquids in the size range of 10 to 2000 nm. Particles that range in size from 15 to 25 nm are towards the limit of detection of the NTA. The lower size limit for weakly scattering particles, such as viruses, is ~40 nm. For strongly scattering particles, such as gold particles the lower limit is ~10 nm. The method is based on particle Brownian motion where NTA tracks the random movements of particles and calculates the Diffusion Coefficient. The particle size or hydrodynamic diameter can be estimated by using the Stokes-Einstein equation The NTA measurement in this study was performed at Malvern Instruments laboratory, Malvern, Worcestershire, WR14 1XZ, UK. The analysis was performed on a Malvern NanoSight NS300 with a 3.1 software version, equipped with a 405 nm laser, syringe pump and a high sensitivity CMOS camera.
DLS measures particles and molecules in suspension in the size range of 0.3-2000 nm. The Brownian motion of particles or molecules causes laser light to be scattered at different intensities. Analysis of these intensity fluctuations yields the velocity of the Brownian motion and by using the Stokes-Einstein relationship the particle size is calculated. The Brownian motion is, however, influenced by a few parameters such as particle size, concentration, shape, polydispersity, surface properties as well as the viscosity of the solution, which may affect the interpretation and clarity of DLS data.
The DLS measurements in this study were performed at laboratories at SP Technical Research Institute, Stockholm, Sweden using a Malvern Zetasizer Nano. In this report we present the comparison of analysis provided by the three instruments on a sample of contaminated Adeno associated virus (AAV) particles, a common vector used in gene therapy, where the purification process has failed to remove host cell cytoplasmic proteasomes. Proteasomes are multi-subunit protein complexes responsible for degrading cytoplasmic proteins and are often upregulated by cellular stress such as expression of AAV particles. AAV particles are typically in the size range of 29 nm and proteasomes 14 nm.
Sample preparation
The sample: Empty AAV serotype 8, a type of virus like particles (VLPs) without genome.
MiniTEM prep: A small amount of undiluted sample was applied on a hydrophilized EM copper grid with a carbon support. After blotting off the excess sample using a filter paper the grid was washed with H2O (MQ) and stained with 2 % uranyl acetate.
NTA prep: PBS was filtered through an inorganic membrane 0.1 μm and 0.02 μm syringe and used to dilute the sample. PBS was checked prior to analysis to ensure it was particle free. No particles were detected in the filtered PBS.
DLS prep: The sample was diluted with a small amount of PBS and transferred into a single use cuvette. The sample vial was rinsed and gently agitated with several portions of PBS, which were also transferred into the cuvette, until the total volume was approximately 1 ml. Three sub measurements were made at 25° C, the cuvette was turned a few times and another set of measurements was performed.
| Method of analysis | Sample volume (1 Å~ 1012 particles/ml) | Information obtained |
|---|---|---|
| MiniTEM | 3 μl | A total number of 1805 particles were detected.c In the dataset, 941 had the appropriate size of an AAV particle (29 nm) and 864 were of smaller size (14 nm). Morphological data showed intact AAV particles contaminated by proteasomes. |
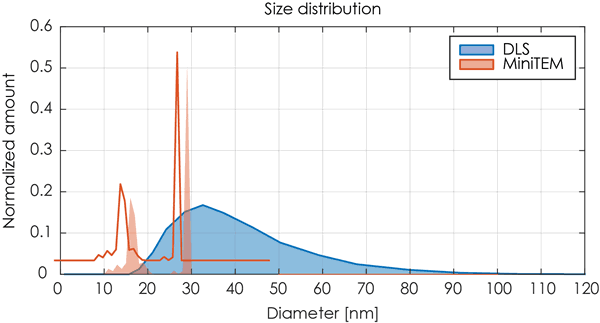
| DLS | 15 μl | Size distribution graph with broad peak indicating a poly-dispersed sample with an average of 35.7 nm. |
| NTA | 15 μl | Unable to detect any particles. |
Results
An automated screening and image acquisition of the prepared sample grid was performed by the MiniTEM software. The automatically performed classification identified two distinct groups of particles with a diameter of 29 and 14 nm respectively. The total number of particles were 1805 and out of those 941 were of the appropriate size of an AAV particle. Morphological analysis of the acquired images revealed that the sample contained a mix of intact AAV particles of correct size but had a significant contamination of proteasomes (48 %) with a diameter of 14 nm.
The DLS analysis of the same sample was not able to differentiate the two classes of particles but showed only one broad peak that potentially could indicate a poly-dispersed sample. An overlay of the DLS data and the MiniTEM peak clearly shows that the two classes of particles with different sizes were covered by the single peak obtained by the DLS measurement. For this sample the resolution of the DLS detection level was not sufficient to differentiate between the two particle groups as the difference in size was too small. Thus the contamination of proteasomes in the AAV sample was not possible to detect using the DLS method.
The lower size limit with NTA for weakly scattering particles, such as small viruses is ~40 nm, AAV particles are thus challenging to measure. The results from the Nanosight analysis show that the AAV particles are too dim and move too fast to track and are only observed as a moving haze in the background.

Conclusions
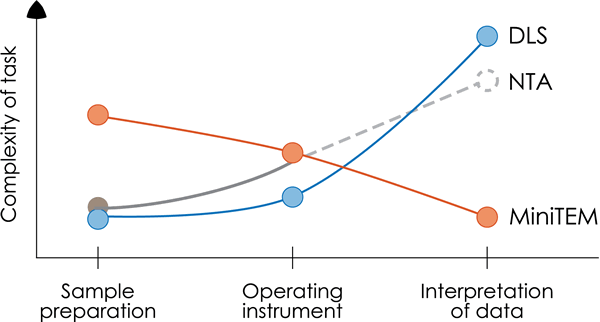
The MiniTEM analysis shows clear advantages in performance and clarity of data for particles < 50 nm of biological origin as shown in this case study of an AAV sample with proteasome contamination. For DLS, the interpretation of data was challenging and misleading as the Zetasizer Nano analysis was not able to differentiate the two classes of particles but showed only one broad peak, possibly due to limitations in detection levels or lack of resolving power. As also shown in this study the NTA method had a clear limitation in detection level as no particles were detected at all. The sample preparation for the MiniTEM analysis is a manual process and requires a trained operator in order to generate a successful read out. Although the DLS and NTA technologies have the benefit of simple sample preparation, the ease of use of the MiniTEM system and the clarity of information on particle size together with visual proof makes the MiniTEM analysis a better choice for this particular analysis.
For more information on MiniTEM, please see http://www.vironova.com/products/minitem/