
Gain Productivity in Protein Purification through Column Loading Optimization
Because Protein A is a valuable resource in any mAb purification strategy, companies often search for ways to improve the productivity of their affinity chromatography step. One strategy worth further investigation is variable column loading. By varying residence time (RT) over the loading phase, productivity from an affinity chromatography step can be significantly improved.
MabSelect SuRe™ protein A affinity resin has long been considered a standard tool for capturing monoclonal antibodies (mAbs) in biopharmaceutical production. Utilizing the same alkali stable ligand, MabSelect SuRe LX has very high dynamic binding capacity and has been developed for high titer antibody processes. To best utilize its high binding capacity, MabSelect SuRe LX is best operated at 6 min residence time during load. This article summarizes studies on designing customized loading strategies to shorten the average residence time when using MabSelect SuRe LX with the goal of improving productivity (calculated as the amount of mAb purified per volume resin and time) even further, without affecting capacity. By using variable residence times (including residence times shorter than 6 min) during the loading phase, productivity over the cycle was increased by nearly 40%, relative to a reference run at a single residence time. In addition, theoretical studies, based on knowledge of the shape of the curve of dynamic binding capacity (DBC) on residence time, showed almost identical results as obtained in the experimental studies.
Study Rationale
MabSelect SuRe LX’s higher capacity is reached at 6 min residence time (RT) during loading, which is a normal loading time in industrial applications. The goal with this study was to investigate the possibility to reduce residence time during load by designing an innovative loading strategy to improve the productivity even further, without significantly affecting capacity.
One way to address this is to use variable RTs during the loading phase. This involves dividing the loading step into several steps, with variable RTs and flow rates (Fig 1). Using variable RTs during loading is not a new concept (1), but the high dynamic binding capacity at longer RTs allows for new possibilities when using MabSelect SuRe LX.
A variable loading approach has also been shown to improve the binding capacity of MabSelect SuRe LX resin (2).
Figure-1
 single RT over loading phase and (B) variable RT over loading phase")
Materials
MabSelect SuRe and MabSelect SuRe LX
MabSelect SuRe is a recombinant protein A based affinity resin, designed for the capture of mAbs at process scale. Its optimized, cross-linked high flow agarose matrix gives at least five times higher fluid velocities as compared to conventional cross linking. MabSelect SuRe has an alkali-tolerant rProtein A ligand that allows the use of rigorous and cost-effective cleaning-in-place (CIP) and sanitization protocols based on 0.1 to 0.5 M NaOH. Further, the ligand is protease stable, leading to lower ligand leakage. MabSelect SuRe LX has been further developed from MabSelect SuRe to give even higher binding capacity.
Methods
The productivity optimization procedures described in this article involve four main steps:
- Determination of Dynamic Binding Capacity (DBC) at various RTs
- Determination of optimal RT during load
- Experimental analyses using Design of Experiments (DoE)
- Theoretical modeling. Theoretical modeling was performed to evaluate the possibility to optimize the variable RT over a minimum number of experiments.
DBC at different RTs
The first step in the optimization procedure was to establish dynamic binding capacity at different RTs. TricornTM (5 × 100 mm) columns were packed with 2 mL MabSelect SuRe LX (10 cm bed height) and loaded with mAb-containing harvested cell culture fluid (HCCF). Fractions were collected during load and analyzed with a BiacoreTM T200 system RT was varied at 1, 1.2, 2, 3, 4, 5, 6, and 10 min, and 10% breakthrough capacity (Q b,10) was determined for each RT. All RT experiments were performed on ÄKTA systems.
Chromatography method for DBC measurement
The column was first equilibrated with 5 column volumes (CV) of 20 mM sodium phosphate, 150 mM sodium chloride (NaCl) and the cell culture supernatant was subsequently loaded at the respective RTs. When the breakthrough occurred the unbound material was washed out with equilibration buffer. The bound mAb was eluted with 5 CV of 100 mM acetic acid and the column was neutralized with equilibration buffer prior to CIP with 0.1 M NaOH for 15 min before the column was re-equilibrated with equilibration buffer.
Optimizing the combination of RT during load
Table 1.
Based on the DBC at different RTs, an optimization analysis was performed using Modde™ (Umetrics) DoE software (see Table 1). A combination of three RTs were chosen: the last was fixed to 6 min while the first two were optimized for the shortest average RT. Short RT will give the best productivity provided the capacities are kept constant.
Chromatography method for variable RTs
The column was first equilibrated with 5 CV of 20 mM sodium phosphate, 150 mM NaCl and the cell culture supernatant was then loaded at the shortest RT (RT1), followed by the intermediate RT (RT2), and then the final RT (RT3) of 6 min.
For all RTs the column was loaded to 80% of (Q b,10)for the respective RT. After completing the load the column was washed with equilibration buffer. Once the UV signal had returned to 200 mAU, the flow rate was increased and washing continued until a total of 5 CV of equilibration buffer was passed over the column. This was followed by an intermediate wash using 100 mM sodium acetate (pH 6) for another 1.5 CV, before the elution with 100 mM acetic acid. The elution peak was collected between 100 mAU and 100 mAU and when the collection had finished, another 2 CV of elution buffer was passed over the column to strip off any remaining MAb. The column was neutralized with equilibration buffer before a 15 min CIP with 0.1 M NaOH.
Analyses
Concentration determination of mAb
Concentration determination for the cell culture supernatant and fraction from the DBC runs were analyzed with a Biacore T200. MabSelect SuRe ligand was immobilized using EDC/NHS chemistry to a level of about 3000 RU on a CM5 chip.
Note: Biacore Sensor Chip Protein A with immobilized MabSelect SuRe ligands are now also available for purchase. These ready-to-use sensor chips, for antibody concentration and kinetic analysis, eliminate the need to develop immobilization and regeneration conditions.
Recovery
Eluates were analyzed with size exclusion chromatography (SEC) and the returned area was compared to a standard curve obtained by injecting different amounts of the mAb reference standard on the column. The standard curve was constructed by plotting the nominal mAb concentrations versus the respective obtained total area.
Determination of aggregate concentration
Fractions from the chromatography runs were collected and analyzed by SEC on a SuperdexTM 200 Increase 10/300 GL column. The peaks were integrated and the relative aggregate concentrations (in percent) were determined
Determination of host cell protein (HCP) and protein A content
HCP content in the elution fractions and product pools were analyzed using commercially available anti-CHO HCP antibodies (Cygnus Technologies Inc.) and Gyrolab™ workstation (Gyros AB). Protein A content was determined using a commercially available ELISA kit (Repligen Corp.).
Charge variants
Charge variants were analyzed using a ProPac™ WCX 10 2 × 250 mm column (Thermo Fisher). The analysis was carried out on an Agilent 1260 system.
Results
Experimental studies
DBC for the different tested RTs varied from 15 to 58 g/L in the analyzed time range (Fig 2). When combining two relatively short RTs, 2 followed by 4 min (average RT of 2.6 min), a higher capacity was obtained relative to a single RT at 3 min. A higher capacity was also obtained when comparing a combined, longer RT (4 min followed by 10 min; average RT of 6.1 min) with a single RT at 6 min.
On average, a variable residence time run yielded 95% of the breakthrough capacity of the longest chosen residence time (e.g., a three step load where the longest time was 6 min resulted in 95% (Q b,10)of a standard run using 6 min as the residence time).
It is the response of DBC to RT that determines the impact of the variable RT loading approach on productivity. Note that in Figure 2, the DBC continues to increase with increased RT. This response is critical if the goal is to achieve higher productivity by implementing variable RT loading. The response of DBC to RT is unique to each mAb; therefore, this curve needs to be developed experimentally. Note that the DBC obtained using variable RT loading (red dots) is consistently higher than that obtained using single RTs. This is because the variable RT technique allows for the DBC with the longest RT, while reducing the average RT for the load.
Figure 2.

DoE for optimal RT
DoE was used to find the optimal combination of RTs to maximize the productivity for MabSelect SuRe LX (Table 2). The experiments were performed as three consecutive loadings where the RTs of the first two were varied and the third was always kept as 6 min RT.
Table 2.

The productivity at a single residence time of 6 min was used as reference to calculate increase in productivity when performing loading at varied RTs. The DoE showed little variability in terms of productivity and load time, suggesting that the process is robust and will not be prone to large changes in productivity or process time if there are small variations in the achieved RTs. The eluates were also analyzed for product quality and these results were also consistent (Table 3).
The analytical data from the DoE experiments (Table 3) were evaluated as responses with no obtained model – the data showed no significant difference between RTs including the reference at 6 min for any of the analyzed parameters, pool volume, recovery, aggregates, HCP, and charge variants.
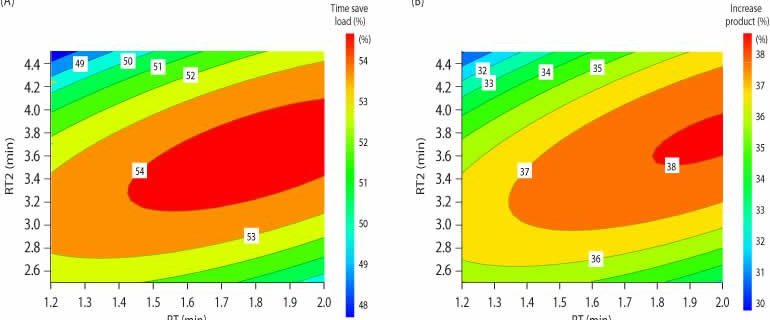
Using the DoE data from Table 2, surface plots (Fig 3) were constructed to visualize the optimal combination of RTs in terms of load time and productivity. Close to 40% productivity increase was realized when utilizing variable loads of 1.6, 3.5, and 6 min (Fig 3B).
Figure 3.

Table 3.
Investigation of variable RT during load
Figure 4B shows the results of a run using the two shorter, optimized RTs followed by 6 min for the longest RT. Up to 80% of (Q b,10)was loaded for each RT. The chromatogram is nearly identical to a reference run with constant loading time of 6 min RT (Fig 4A). Analysis of the elution pools from both runs showed that in terms of recovery and HCP levels. However, when the same two chromatograms are superimposed, using time on the x axis (Fig 5), a much shorter cycle time is found for the experiment with multiple RTs.
Figure 4.

Figure 5.
Theoretical modeling
When the shape of the curve of DBC versus RT has been determined (Fig 2), it is possible to calculate the optimal RTs without doing extensive optimization/DoE analyses. Figure 6 shows the parameters used to construct a theoretical model of optimal RTs, using DBC at different RTs and resulting cycle time calculations.
Figure 6.
DoE methods similar to those in the experimental studies were used to construct a surface contour plot for productivity increase (Fig 7). The results of the theoretical modeling were remarkably similar to those in the experimental study (Table 4), showing that knowledge of the DBC versus residence curve characteristics allows for accurate theoretical calculations, without extensive optimization/DoE modeling effort.
Figure 7.
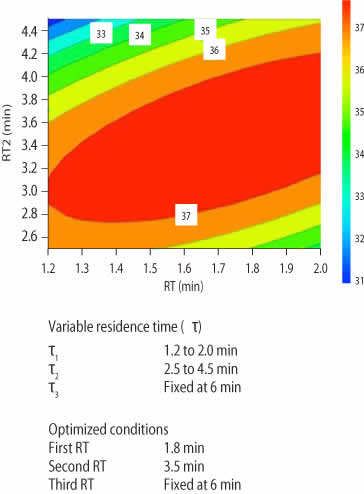
Table 4.
Conclusions
MabSelect SuRe LX is a high capacity protein A resin that can bind approximately 60 g/L IgG. To best utilize its high capacity, the resin should be operated at 6 min RT. In order to maximize productivity one would like to achieve high capacities for MabSelect SuRe LX while operating at shorter RTs. The goal of this study was to assess the possibility of using variable RTs to increase productivity for MabSelect SuRe LX, while maintaining capacity and performance.
By dividing the loading phase and using different flow rates for each phase, the average RT can be shortened while capacity is kept nearly constant. In this study, the longest RT was fixed to 6 min in order to compare it to a reference standard load with a single RT of 6 min. The shortest RT was set to 1.2 min, which is determined by the pressure flow properties of the resin (500cm/h or 1.2 min RT for 10 cm bed height). A design was created where the shortest RT was varied between 1.2 to 2 min followed by an intermediate RT from 2.5 to 4.5 min and a final RT of 6 min. For each RT the column was loaded to 80% of the DBC at 10%. The result from this design proved that the average RT could be shortened to 2.9 min, with capacity similar to that for a single RT at 6 min. This resulted in a productivity increase of almost 40% relative to the reference RT.
Utilizing variable RTs can significantly increase productivity, while maintaining capacity and purification performance. Theoretical modeling, constructed with knowledge of the DBC vs RT curve, showed nearly identical results to the experimental study.
If you are interested in more protein purification blogs, you can also check out our Protein Skills blog
Footnotes
-
1. Ghose, S. et al. Use and optimization of a dual- owrate loading strategy to maximize throughput in protein-a affinity chromatography. Biotechnol. Prog. 20, 3, 830–840 (2004).
-
2. Zhang et al, Maximizing binding capacity for protein A chromatography, Biotechnology Progress 30, 6, 1335–1340 (2014)