
Rapid Characterization of Virus Like Particles Informs Vaccine and Gene Therapy Downstream Processes
When working with viral systems, either during manufacture of viral-based vaccines or gene therapies, having the right analytics is crucial. This is particularly true when optimizing downstream processes and in characterizing product lots for purity. Information on the amount of virus like particles present, particle structure and their biological impact not only informs the manufacturing process, but also final product purity and quality. While these answers are important they are not always easy to access. The following case study demonstrates the use of the MiniTEM as a convenient analytical, direct-measurement method to characterize virus like particles (VLPs) or virus preps. While this case study focuses on influenza vaccine, it is important to note that this is just one example and that the technology could be used in many viral-based vaccine or viral vector manufacturing scenarios.
In this case study, the MiniTEM is used to determine the proportion of helper virus and debris as well as the portion of defective non-spiked virus or defective virus of altered size. The MiniTEM provides a quick method for obtaining these analytics and provides information that other methods cannot. For example, other particle counters can quantify virus particles based on size, but can not distinguish non-infectious from infectious virus, or in this case spiked from non-spiked virus. Thus, the miniTEM provides the added analytical benefit of a quick “eyes-on” analysis tool to characterize VLP/virus preps.
Abstract
MiniTEM™ is a microscopy system that can provide powerful data on sample purity and can be used to assess the portion of influenza VLP particles that present hemagglutinin spikes on the surface.
In this case study, six different purified influenza VLP samples taken after the downstream process were analyzed. Relative quantification of influenza VLP particles with hemagglutinin spikes, as well as the amount of particles without spikes, debris and baculovirus in each sample, was calculated and presented graphically. This information can be used to confirm that critical morphological features are maintained, and impurities removed, during the manufacturing process.
Introduction
During the downstream development of a viral-based vaccine or gene therapy product, information is needed on the type of structures present in the sample, their relative amount and correlation of their presence to biological effects. A robust method is needed that allows reliable classification of the structures.
Transmission Electron Microscopy (TEM) is a versatile technology used to study the morphology and structure of biological specimens. Negative staining (nsTEM) is a quick and easy preparation technique which allows specimen characterization by virtue of the particles being deposited on a support and embedded in a layer of stain solution comprised of a heavy metal salt. The use of stain significantly increases contrast in the imaging. When the purity of a sample needs to be assessed, this method provides relevant information on sample characteristics.
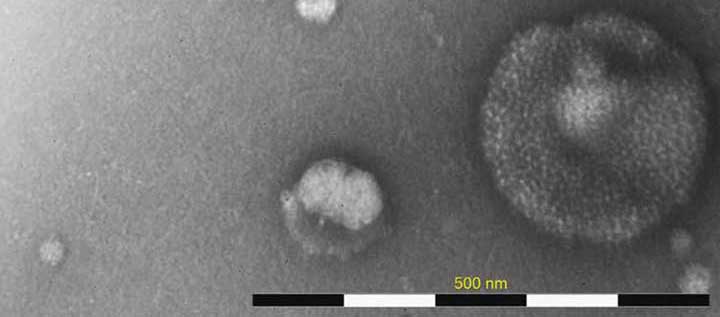
Influenza VLP samples, produced using the BEVS/IC system, and taken at any point during or after the downstream processing, typically comprise a mix of particles with various morphological characteristics. The primary influenza VLP particle can vary in both shape and size and additionally show differences in the distribution of surface hemagglutinin (HA) structures. The HA distribution variability can be due to poor incorporation of HA spikes during the budding off from the host cell or later loss during the downstream process. Particles with prominent HA surface structures have a tendency to bind more stain and thus appear darker when imaged with MiniTEM. Particles originating from the host cells or baculovirus transfection system can also be present in the sample. In this case study, we show how MiniTEM can be used to automatically generate a relative quantitative analysis of different particle classes in 6 different Influenza VLP samples from different strains that have been subjected to the same upstream and downstream process. The data obtained with MiniTEM may not exactly correspond to the absolute numbers of each particles in solution but can be used as a comparison between samples.
MiniTEM
MiniTEM is a 25kV transmission electron microscope system specifically designed for highly automated image acquisition and particle detection, enabling nanoparticle characterization. The compact system runs in any laboratory setting and its operation does not require specialist skills.
The main steps of an automated MiniTEM workflow
The image analysis software capabilities of MiniTEM involve particle classification using pattern recognition and machine learning. A MiniTEM workflow, once created, can be used for automated analysis of multiple samples of the same type, e.g., to compare different purification steps or starting material.
A MiniTEM workflow consists of the following main steps:
- Representative waypoints of the sample are selected and imaged.
- Structures detected in the acquired images are defined as particles using the MiniTEM image analysis toolbox.
- Detected particles are measured in terms of characteristic features e.g. area, circularity or stain embedding.
- Common descriptive features are used to classify particles into distinct groups.
- Particle measurements and comparisons between particle groups are graphically presented together with statistical analysis.
Sample preparation
Samples were prepared using the sitting-drop procedure and negatively stained. In brief, 3 μL of sample was applied on a glow-discharged, carbon-coated 400 mesh copper grid and incubated for approximately 30 s. The excess of sample was blotted off and the grid was washed with sterile water and stained using 2 % uranyl acetate for 10 s. Finally, the stain was blotted off and the grid was left at room temperature to air dry.
Influenza virus like particle production
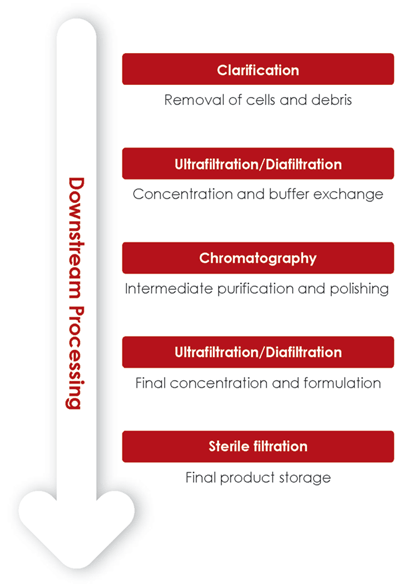
The concept behind the modern generation of influenza vaccines is the use of multivalent VLPs encompassing a combination of multiple influenza hemagglutinin (HA) to mimic a variety of influenza subtypes. The goal is to create a “universal” vaccine and to thus avoid the need for annual updates. Baculovirus expression vector (BEVS)/ insect cell (IC) system has been used as a platform to produce, amongst others, influenza VLPs (Fig 1).
A typical downstream process starts with a clarification step, followed by a number of filtration and chromatography steps for intermediate purification and polishing (Fig 2). During downstream process development, the outcome of each operation unit needs to be closely monitored. It is important not only to confirm the presence of HA-spiked particles, but also to verify the removal of impurities such as baculovirus, host cell debris or non-VLP particles.
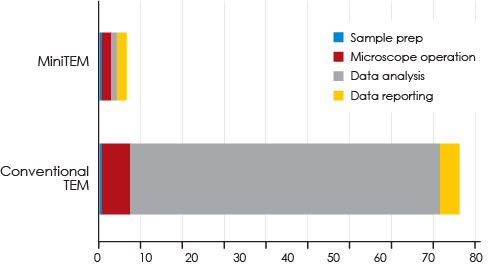
Several analytical indirect methods are used to verify critical quality attributes such as Nanoparticle Tracking Analysis (NTA) enzyme-linked immunosorbent assay (ELISA) HA assays, Biolayer interferometry analysis or Surface Plasmon Resonance (SPR). However, direct visualization of particle morphology is only possible with TEM. As a consequence of MiniTEM providing quantitative data, the relative proportion of each particle class can be obtained. MiniTEM data can assess the amount of VLP particles with spikes, particles similar to VLPs without spikes as well as determine the ratio of baculovirus and debris.
Application of the MiniTEM workflow to compare morphological footprint of different influenza virus like particle samples
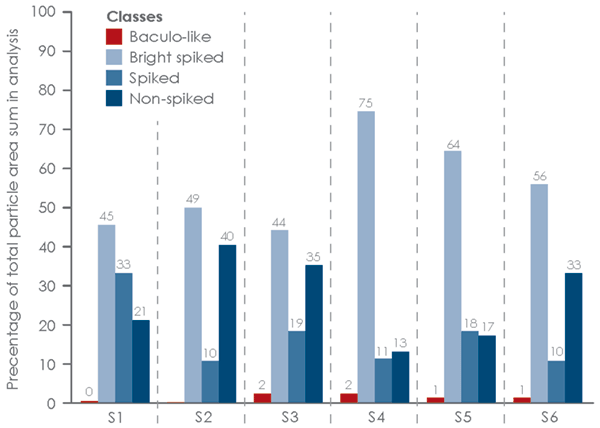
Six influenza VLP samples subjected to the same upstream and downstream process steps were analyzed by MiniTEM. These VLP samples are the result of VLP production with different strains from different subtypes of the influenza virus. The goal was to assess, for each sample, the amount of the amount of VLP particles with spikes, particles similar to VLPs without spikes and to detect baculovirus presence.
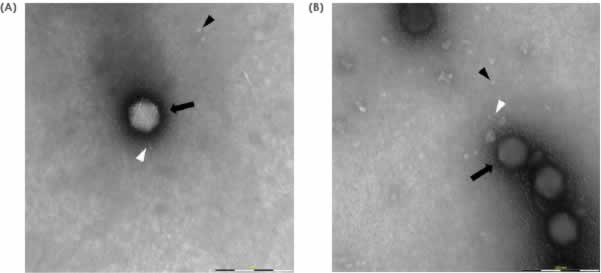
The MiniTEM workflow, developed for this sample type, was applied to around 250 images automatically acquired for each sample. In the subsequent image analysis, particles were detected and classified according to measurements of characteristic features such as size, shape, stain intensity and surface structure. Four distinct particle classes were found (Fig 3).
- Baculovirus shaped particles (Baculo-like)
- Bright particles with prominent spikes (Bright spiked)
- Dark particles with prominent spikes (Spiked)
- Particles without spikes (Non-spiked)
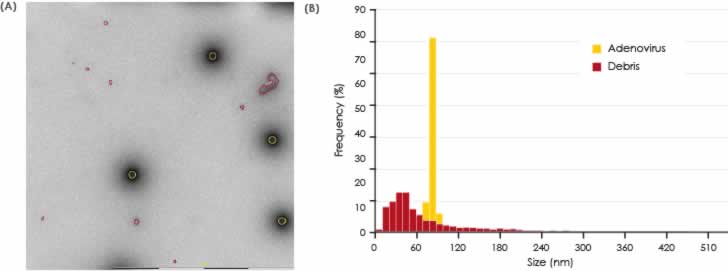
The results are presented graphically in Fig 4 and 5. The non-spiked particles are the most abundant, although the smaller size indicates that these could represent small debris or vesicle-like particles. A small number of baculo-virus particles were found. These particles are bigger in size with a shape that is different from VLPs. For this reason, baculo-like particles represent a significant portion of the total particle area (Fig 4) but in terms of number of particles they only constitute a minor portion of the entire particle set. The total numbers of each particle class in all samples are shown in Fig 6.
area in each sample.
each sample.
Conclusion
In this case study the capabilities of MiniTEM to automatically perform relative quantitative comparison of the ratio of different particle types present in six influenza VLP sample preparations are demonstrated. The MiniTEM image analysis software was able to obtain a relative quantification of the number of VLP particles with the expected size that carry HA spikes on their surface. A quantification of small particles, debris and baculovirus-like particles present in the sample is also provided.
A structural footprint of the entire sample is thus obtained with quantitative data on number, size and portion of each particle category in the different samples. The data obtained with MiniTEM may not exactly correspond to the absolute number of each particle in solution but can be used to compare samples and evaluate the behaviour of viral particles under different process conditions.
Particles without spikes in the size range expected for the VLPs could either be naked VLPs or particles originated from the host cells. In order to distinguish these, complementing analytical methods such as ELISA need to be applied.