
Subvisible Particle Characterization: Why Simply Counting Shadows Leaves You in the Dark
Summary
Significant advances in analytical technology over the past few years have improved the quantification and characterization capabilities for subvisible ( 1 – 100 µm) and submicron particles (≤1 µm). As the technology continues to improve so do the expectations of regulatory agencies for sponsors to characterize particles in these size ranges. However, multiple orthogonal methods are required to span the entire range and accurately characterize the particle profile. Each instrument has its own limitations based on detection method and properties of therapeutic protein products that must be well understood to generate high quality data. KBI Biopharma has extensive experience with particle detection methods, as well as, in-depth particle data analysis. KBI’s Particle Characterization Core team can help choose appropriate orthogonal particle to combine in order to accurately quantify, characterize and identify particles in specific therapeutic protein products for all size ranges based on clients’ needs
Analysis of Subvisible Particles
The quantification of subvisible particles in injectable therapeutic protein products, primarily out of concern on the presence of extrinsic particulate contaminants, has been established by the US and European Pharmacopeias under Chapter <788> and 2.9.19, respectively. In accordance with these Rules and Procedures, limits established for subvisible particulate content were calculated based on the risk of ≥ 10 µm and ≥ 25 µm particles blocking certain percentages of blood vessels in the lungs following intravascular infusion. Since their publication, a shift in the industry has moved towards more convenient administrations such as subcutaneous and intramuscular injections. This shift opened a discussion of the relevance of the pharmacopeia chapters, specifically for protein therapeutics. Over the past decade, a substantial amount of work has been published that investigates the propensity of proteins to aggregate and form subvisible particulates (1-5) and the potential risk of immunogenicity due to presence of protein aggregates and subvisible protein particles in therapeutic protein products (6-9). Concurrently, the FDA has become increasingly concerned with the safety and efficacy of therapeutic protein products for the reason that subvisible particles between 0.1-10 µm were not being actively monitored in therapeutic protein products (10,11). As a result, a new USP monograph, Chapter <787> “Subvisible Particulate Matter in Therapeutic Protein Injections,” was drafted and became effective in 2014. In the new USP monograph, in addition to allowing smaller particle size detection reporting, several improvements such as reduction of volume required for testing were implemented. While Chapter <788> required a minimum volume of 25 mL to complete a test, the new Chapter <787> allows for a volume as low as 1 mL to complete the test. The small volume method not only saves costs by requiring less product to perform the method, but also allows for the determination of vial-to-vial or syringe-to-syringe variability of particle counts. USP still only requires the reporting of ≥ 10 µm and ≥ 25 µm size ranges but does allow for the establishment of product specific limits.
In addition to USP Chapter <787> a general information Chapter <1787> “Measurement of Subvisible Particulate Matter in Therapeutic Protein Injections” was drafted. This chapter recommends the collection of 2-10 µm (≥ 2 µm and ≥ 5 µm) subvisible particle concentrations and gives guidance on orthogonal methods to characterize subvisible particles as inherent intrinsic or extrinsic; it specifically calls out the need to distinguish silicone oil from other proteinaceous, inherent or intrinsic particles. In addition to the new USP monograph and informational chapters, The FDA has approved a Guidance for Industry on the Immunogenicity Assessment for Therpeutic Protein Products that states “[assessment] should be made of the range and levels of subvisible particles (2-10 microns) present in therapeutic protein products initially and over the course of shelf-life…..As more methods become available, sponsors should strive to characterize particles in smaller (0.1 – 2 microns) size ranges.” Furthermore, the EMEA published in their Guideline on Development, Production, Characterisation and Specifications for Monoclonal Antibodies and Related products that “[the] formation of aggregates, sub-visible and visible particulates in the drug product is important and should be investigated and closely monitored on batch release and during stability studies. In addition to the pharmacopoeial test for particulate matter, other orthogonal analytical methods may be necessary to determine levels and nature of particles.”
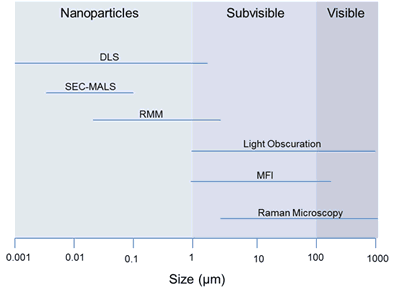
As more regulatory agencies start to request additional particle detection, specifically below 10 micron, it becomes imperative for companies to fully understand the orthogonal methods available and their limitations. As discussed in the general information Chapter <1787>, particles in the ≤ 10 µm size range can be highly variable due to other inherent or intrinsic components, such as silicone oil. Therefore, combining orthogonal techniques to help identify and characterize these particles becomes essential for data analysis and interpretation. Some examples of commonly used orthogonal analytical methods to light obscuration for characterization of subvisible and submicron particles are listed below in Table I along with some of their advantages and disadvantages.
| Metrod | Principle of Operation | Advantages | Disadvantages | Sample Size Range |
|---|---|---|---|---|
| Dynamic Light Scattering (DLS)/Static Light Scattering (SLS) | Based on the Brownian motion of particles in solution and the Rayleigh light scattering relationship of scattering intensity being proportional to hydrodynamic radius to the sixth power | Nondestructive, can provide size distribution in submicron range | Qualitative information, not quantitative (no particle counts). Number intensity can be sensitive to heterogeneous populations. Not optimal for high concentrations. | 1 nm – 1 µm |
| Nanoparticle Tracking Analysis (NTA) | Light scattering coupled with CCD camera | Quantifies particles (particle size and concentration ) in the submicron range | Not optimal for high concentration solutions, Less reproducible with heterogeneous populations | 1 nm – 2 µm |
| Light Microscopy | Visible light and optical lenses are used to produce images which particles can be manually sized and counted from | Provides images through which additional shape information can be determined by analyst | Low throughput, low reproducibility and labor intensive. Typically requires filtering of sample | 0.5 µm – mm |
| Electrical Sensing Zone (ESZ) | Voltage pulse in sensing zone in which current constantly flows | Simple, robust and reproducible. Volume based detection, independent of shape, refractive index, etc. | Often requires dilution of sample into buffer of appropriate conductivity. Provides no additional information regarding the shape, transparency, etc. of particles | 0.5 µm – mm (20-80% of aperture size) |
| Flow-Imaging Technology | Detects particles using Bright-field images captured as a solution is passed through a flow cell. | High throughput, reasonable sample volume (~1 mL/analysis), higher sensitivity for transparent particles, classification of particles based on morphological parameters calculated from images | Can undercount and undersize particles with RI close to that of solution matrix (≤ 0.5). Difficulty distinguishing particles based on morphological parameters below 5 µm -10 µm | 1 µm – 100 µm |
| Resonant Mass Measurement | Measures frequency changes of a suspended microchannel as particles pass through | Provides particle size concentration and density of particles detected based on buoyancy mass. | Limited range of detection, typically good for syringe samples but not vials. No shape or morphology information. | 30 nm – 5 µm |
| Electron Microscopy (EM, SEM, STEM) | Electron imaging of particles | Can provide 3-D information on particle shape and morphology, STEM can provide atomic resolution | Costly equipment, low throughput, sample preparation can be complex, not quantitative (no particle size distributions) | 0.1 nm – cm |
| Fourier Transform Infrared (FTIR) Microscopy | Visible light microscope coupled with IR laser identification | Can provide chemical identity, secondary structure of proteins in particles | Costly equipment, low throughput, not quantitative (particle counts), water can interfere with signal | 10 µm – cm |
| Raman Microscopy | Visible light microscope coupled with Raman laser | Can provide chemical identity of particles and complex particles, can be automated to provide particle distributions, images and morphology, no interference with water can perform in solution phase | Fluorescence can interfere with signals. Small volume for analysis (~70 µL) | 2 µm – mm |
Subvisible Particle Testing, Classification and Identification

KBI’s Particle Characterization Core provides novel orthogonal methods for the quantification of subvisible particles, and also specializes in the classification and identification of particles with image analysis and Raman spectroscopy. At KBI we have a wealth of experience with all the current methods and can help clients determine what combination of techniques best characterize individual products and provide comprehensive data compilations to span the 0.1 – 100 µm size range, as needed. We also have extensive experience compiling and interpreting subvisible and submicron particle data to support IND filings and BLA licensures.
KBI’s state-of–the-art equipment with detection limits spanning nm to mm size ranges include
DLS (Zetasizer)
- SEC-MALS
- Resonant Mass Measurement (Archimedes)
- Light Obscuration (HIAC)
- Micro-Flow Imaging (MFI 5200)
- Raman Microscopy (Morphologi G3-ID)
Dynamic Light Scattering (DLS)
DLS is a nondestructive qualitative method to determine size distribution of particles in the submicron range of 0.001 – 1 µm. The method is based off Brownian motion of particles in solution and the Rayleigh light scattering relationship of scattering intensity being proportional to hydrodynamic radius to the sixth power. Due to the Rayleigh relationship, DLS can be very sensitive to the presence of larger particles such as dust or micron-size protein aggregates/particulates. For this reason, the sample preparation is of utmost importance when performing DLS analysis. In addition, the diffusion of a particle is a function of the viscosity of solution; therefore, knowing the exact viscosity of samples is important for calculating the resulting hydrodynamic radii
SEC-MAL
The addition of Multiangle Light-scattering (MALS) detectors to SEC-HPLC assays allows for the measurement of molecular weights for each peak eluted from the assays. The LOD and accuracy are dependent upon the validated SEC assay; however, the benefits of having MALS on-line detection substantial. The molar masses determined for oligomer peaks can give insight into association-dissociation behavior. In addition to characterizing the molar mass of impurities present in samples, when coupled with on-line RI detection significant characterization of PEGylated proteins can be achieved
Resonant Mass Measurement (RMM)
The Archimedes RMM system detects particle buoyancy mass by changes in frequency of a resonator as individual particles pass through. This technique is a true orthogonal technique to MFI and LO since it does not rely on refractive index changes or blockage of light, but instead on the volume of solution displaced by individual particles. Archimedes is recommended for detection of particles in the 0.5 – 5 µm size range when solutions have silicone oil droplets present (Pre-filled syringe, device-combinations, etc.). MFI is unable to distinguish between silicone oil and other inherent particles below 5 micron. The combination of RMM and MFI allows for the full characterization of particles in the 1 – 10 µm size range, which has been of interest lately.

Light Obscuration (LO)
Light obscuration (LO) is the most widely used subvisible particle assay in the pharmaceutical industry and is the preferred compendial method (USP, EP, JP). LO detects particles based on blockage of light by individual particles passing through a light sensing zone and provides particle size and counts, assuming spherical shape of particles. The disadvantage of LO is that it provides the least amount of information compared to flow imaging and RMM methods. If an increase in particle counts is observed, it is not known whether that increase is a result of extraneous matter, protein particulation, microbubbles or silicone oil with LO results alone. Performing orthogonal methods such as flow imaging alongside LO has become the industry standard to help characterize and classify the subvisible particles present in parenteral products.
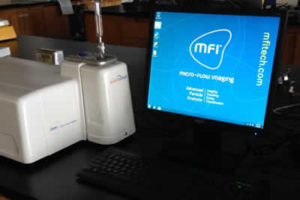
Micro-Flow Imaging (MFI)
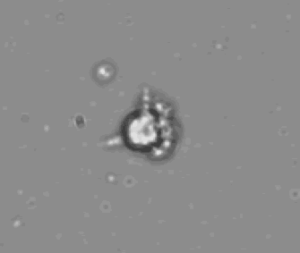
MFI is a more sensitive orthogonal method to LO that detects particles using Bright-field images captured as a solution is passed through a flow cell. The detection method relies on refractive index changes rather than blockage of light, which makes it more sensitive to translucent particles such as protein. The images collected are used by the software to create an extensive database of information (size, shape, transparency) on the particles detected that can be used to classify and differentiate particles. The ability of MFI to distinguish silicone oil from proteinaceous or extrinsic particles is a significant advantage of this technique. The visual inspection of images can also provide important information on the types of protein particles being formed (density, fibrillar vs compact, complexes of silicone oil and protein, etc.). MFI has become a valuable technique routinely used to complement compendial methods for subvisible particle detection.
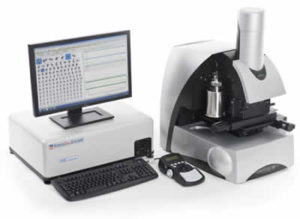
Raman Microscopy
Raman Microscopy is a powerful tool to help identify subvisible and visible particles. Unlike FTIR, Raman spectroscopy is not sensitive to the presence of water in samples and allows for aqueous solutions to be analyzed. The automated Raman microscopy system (Morphologi G3-ID) used at KBI allows for faster characterization and identification of particles in solution. Many inherent particles within a parental can have similar morphologies which can cause issues in classification with methods such as MFI. For example, excipients such as polysorbate can degrade and form insoluble particles that have similar shape and transparencies to proteinaceous particles. Using the Morphologi G3-ID system, it is possible to chemically ID subvisible particles down to 3 to 5 µm is size, allowing for differentiation of subvisible particles with similar morphologies. In addition, the ability to perform spectral mapping across an individual particle allows for proper identification of particles that are complexes of material such as silicone oil and protein or silicone oil and surfactant. Automated Raman microscopy is not as high throughput as flow imaging techniques, but has proven repeatedly to be an invaluable method to answer the ‘what is it’ question that arises continuously in development, manufacturing and stability programs.
Classification and Identification of Particles
Compared to other particle analysis methods, the Light Obscuration method does not generate particle images. Micro-Flow Imaging (MFI) systems collect the images of particles with which multiple morphological parameters can be determined. Due to the highly spherical nature and known refractive index of silicone oil droplets, MFI is a very useful tool to classify silicone oil from proteinaceous or other inherent particles (12). The unique classification of silicone oil can help determine silicone oil content introduced to products by various sources such as syringes, devices or stoppers. The classification of silicone oil is also beneficial to help eliminate the variability of silicone oil content introduced from syringes or various container/stopper configurations from total particle counts, which allows more accurate tracking of protein particles over shelf-life or during forced degradation. Due to image resolution, the classification of particles on morphological parameters determined from images can only be performed for particles ≥ 5 µm. Resonant mass measurement (RMM) is capable of detecting smaller particles ranging from 300 nm – 5 µm, can classify particles based on their density, and can provide a true orthogonal analysis to MFI. The density of silicone oil is less than water and protein which allows it to be distinguished from other particles by resonant mass measurement. Thus, a combination of RMM and MFI allows for the complete classification of silicone oil vs. protein or other inherent particles in the 1-10 µm range where the highest variability of silicone oil droplets tends to occur.
While the classification of silicone oil from protein is fairly straightforward with images analysis and buoyancy measurements, the classification of proteinaceous particles from other inherent particles is more difficult. Many excipients such as polysorbate can form particles with similar image properties to that of proteinaceous particles. Automated Raman microscopy offered at KBI can provide image analysis as well as Raman spectroscopy of particles ≥ 3-5 µm in size. Collecting Raman spectroscopy of subvisible and visible particles provides a positive chemical identity of particles. KBI offers the unique Raman spectral ID of subvisible particles in solution that can assist with formulation, purification and process development. KBI’s Particle Characterization Core facility is also well-trained in the identification of complex subvisible particles consisting of multiple identities, investigating interactions of different components within products, as well as forensic ID of visible particles identified in fill finish and inspection operations.
About the Author
Amber Fradkin, Ph.D., is the Director of the Particle Characterization Core Facility at KBI Biopharma.
KBI Biopharma, Inc.
KBI Biopharma is a Contract Development and Manufacturing Organization (CDMO) with state of the art facilities in North Carolina and Colorado. KBI offers its clients a range of services including process development and cGMP manufacturing of microbial and mammalian expressed recombinant proteins and antibodies, analytical formulation and stability, and analytical development and testing. Over the past few years KBI expanded its capabilities to include mass spec services through its Mass Spec Core facility and now KBI has established a Particle Characterization Core facility to provided analysis and characterization for subvisible particles. KBI’s Particle Characterization Core provides specialized analytical testing for subvisible particles ranging from nanometer to micron in size. We employ the latest technologies to bridge the submicron (0.1 – 1 µm), subvisible (1-100 µm) and visible (≥ 100 µm) particle size ranges offering a comprehensive analysis of a product’s particle profile. KBI’s Particle Characterization Core team has extensive experience compiling and interpreting subvisible and submicron particle data to support IND filings and BLA licensures.
Footnotes
-
1. Barnard, J. G., Babcock, K., and Carpenter, J. F. Characterization and quantitation of aggregates and particles in interferon- products: Potential links between product quality attributes and immunogenicity. J. Pharm. Sci. 102, 915-928, 2013
-
2. Barnard, J. G., Singh, S., Randolph, T. W., and Carpenter, J. F. Subvisible Particle Counting Provides a Sensitive Method of Detecting and Quantifying Aggregation of Monoclonal Antibody Caused by Freeze-Thawing: Insights Into the Roles of Particles in the Protein Aggregation Pathway. J. Pharm. Sci. 100, 492-503, 2011
-
3. Gerhardt, A., McGraw, N. R., Schwartz, D. K., Bee, J. S., Carpenter, J. F., and Randolph, T. W. Protein Aggregation and Particle Formation in Prefilled Glass Syringes. J. Pharm. Sci. 103, 1601-1612, 2014
-
4. Simler, B. R., Hui, G. D., Dahl, J. E., and Perez-Ramirez, B. Mechanistic complexity of subvisible particle formation: Links to protein aggregation are highly specific. J. Pharm. Sci. 101, 4140-4154, 2012
-
5. Singh, S. K., Afonina, N., Awwad, M., Bechtold-Peters, K., Blue, J. T., Chou, D., Cromwell, M., Krause, H. J., Mahler, H. C., Meyer, B. K., Narhi, L., Nesta, D. P., and Spitznagel, T. An Industry Perspective on the Monitoring of Subvisible Particles as a Quality Attribute for Protein Therapeutics. J. Pharm. Sci. 99, 3302-3321, 2010
-
6. Filipe, V., Jiskoot, W., Basmeleh, A. H., Halim, A., Schellekens, H., and Brinks, V. Immunogenicity of different stressed IgG monoclonal antibody formulations in immune tolerant transgenic mice. mAbs 4, 740-752, 2012
-
7. Fradkin, A. H., Carpenter, J. F., and Randolph, T. W. Immunogenicity of Aggregates of Recombinant Human Growth Hormone in Mouse Models. J. Pharm. Sci. 98, 3247-3264, 2009
-
8. Fradkin, A. H., Carpenter, J. F., and Randolph, T. W. Glass Particles as an Adjuvant: A Model for Adverse Immunogenicity of Therapeutic Proteins. J. Pharm. Sci. 100, 4953-4964, 2011
-
9. Fradkin, A. H., Mozziconacci, O., Schoneich, C., Carpenter, J. F., and Randolph, T. W. UV photodegradation of murine growth hormone: Chemical analysis and immunogenicity consequences. Eur. J. Pharm. Biopharm. 87, 395-402, 2014
-
10. Carpenter, J. F., Randolph, T. W., Jiskoot, W., Crommelin, D. J. A., Middaugh, C. R., Winter, G., Fan, Y. X., Kirshner, S., Verthelyi, D., Kozlowski, S., Clouse, K. A., Swann, P. G., Rosenberg, A., and Cherney, B. Overlooking Subvisible Particles in Therapeutic Protein Products: Gaps That May Compromise Product Quality. J. Pharm. Sci. 98, 1201-1205, 2009
-
11. Rosenberg, A. S. Effects of protein aggregates: an immunologic perspective. The AAPS journal 8, E501-507, 2006
-
12. Strehl, R., Rombach-Riegraf, V., Diez, M., Egodage, K., Bluemel, M., Jeschke, M., and Koulov, A. V. Discrimination Between Silicone Oil Droplets and Protein Aggregates in Biopharmaceuticals: A Novel Multiparametric Image Filter for Sub-visible Particles in Microflow Imaging Analysis. Pharm. Res. 29, 594-602, 2012